Saturday, June 10, 2017

WSO2 Products - HTTP Access Logging (create a log file without including timestamp)

You can use access logs to investigate the entries for service and REST API invocations and for Management Console access. Access logs are helpful to monitor your application's usage activities, such as the persons who access it, how many hits it receives, what the errors and many more. 

These information is useful when troubleshooting happens.

In WSO2 products you can customize the http access log configuration by editing the catalina-server.xml which is located


<PRODUCT_HOME>/repository/conf/tomcat/catalina-server.xml

 As the runtime of WSO2 products are based on Apache Tomcat, you can use the Access_Log_Valve variable in Tomcat 7 as explained below to configure HTTP access logs in WSO2 products. In addition, you can customize the access logs based on the supported Access Log Valve attributes.


Create access.log  without appending Date in to the file name


By default Tomcat server will create a log file with including timestamp. 

When the server is running on next day, it will create a new log file. 

The objective of this default behavior is to avoid issues when the log file eventually becomes larger. But when you set the rotatable property to "false", it will disable this default behavior and use a single log file.

We can  change this behavior by configuring either the "rotatable" parameter or "renameOnRotate" parameter in access-log valve section of catalina-server.xml as below. Make sure to change the prefix property as "http_access".


  • Using "rotatable" property


<Valve className="org.apache.catalina.valves.AccessLogValve" directory="$
{carbon.home}/repository/logs"
prefix="http_access" suffix=".log"
pattern="combined" rotatable="false"/>


  • Using "renameOnRotate" property


<Valve className="org.apache.catalina.valves.AccessLogValve" directory="${carbon.home}
/repository/logs"
prefix="http_access" suffix=".log"
pattern="combined" renameOnRotate="true"/>


By setting the renameOnRotate property to "true", tomcat server will not include a timestamp to the log file. So Tomcat will use "http-access.log" file for logging.

 But it'll rename it to include the timestamp when the rotation happens (at the beginning of the next day) and create a new http-access.log file for logging.


During rotation the file is closed and a new file with the next timestamp in the name is created and used. When setting renameOnRotate to true, the timestamp is no longer part of the active log file name. Only during rotation the file is closed and then renamed to include the timestamp. 

This is similar to the behavior of most log frameworks when doing time based rotation."


Saturday, March 4, 2017

WSO2 Data Analytics Server 3.1.0 : How to apply your own custom theme for per dashboard

In Data Analytics server we can deploy a custom theme using a carbon archive file. so we can select a custom theme for each dashboard out of these deployed custom themes. (If we don’t want a custom theme, can use the default theme)

Here in this post I will provide high level instructions for change the look and feel of Dashboards.

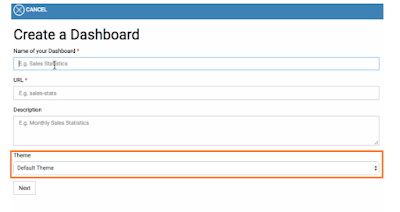
When you are Log into the Analytics Dashboard and opens create dashboard icon you will navigate to create dashboard page. In there you will see a option call “theme”(figure 1.0) you will notice there are no options default theme is the only available theme, but when you create your own themes you could able to see those themes in there and can apply them accordingly when you are about to create dashboard.


Figure 1.0
Please note through this feature, you are allowed to add a custom theme only for the view of the dashboard. you can add your own script files, template files and styles to customize the view of a particular dashboard accordingly.

Here are the steps that you have to carry out 

Step 01

Create a custom theme file
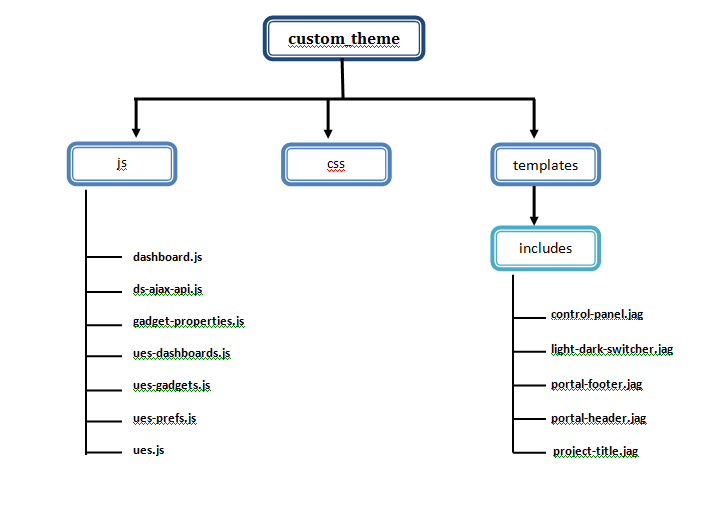
When it is a creating custom theme you need to maintain folder structure as follows(figure 2.0).


figure 2.0

You might be confused where could I find these jaggery files J  no worries  You can find the JavaScript files by navigating through

 <DAS-HOME>/repository/deployment/server/jaggeryapps/portal/ js

jaggery files(.jag files) you can find on location of 

<DAS-HOME>/repository/deployment/server/jaggeryapps/portal/theme/templates/includes 


Note:


‘css’ folder can contain any style sheets with the extension of .css. But the ‘js’ and ‘template’ folders should contain the file naming as defined in the above structure.


Step 02

As I mentioned in above step you have to create custom them file (According to my example i named it as “custom_theme”) according  to your requirement  and from that folder you need to create car file since custom theme file should be create as a carbon archive file which has the extension of .car.
While you creating the car file. you have to create car file manually (for creating car file in DAS server there is official documentation published by WSO2 you can find it here )

Please make sure to change the artifact type of the theme define as ‘dashboards/theme’. For example, the artifact.xml file for a custom theme is as follows.


<artifact name="custom_theme" version="1.0.0" type="carbon/application">
<dependency artifact="car" version="1.0.0" include="true" serverRole="DataAnalyticsServer"/>
</artifact>

 Step 03


Once you have created the carbon archive file for a custom theme successfully, you can deploy it through the carbon application deployer in admin console. To do that Log in to WSO2 DAS management console using admin/admin credentials.

figure 3.0
Click Main, and then click Add in the Carbon Applications menu Click Choose File and select the .car file that you created and upload.

 Step 04


Then navigate to the <IP address:port>/portal/dashboards and At the creation of a dashboard, the user can select the default or custom theme for that dashboard

figure 4.0
you can also change the theme of a dashboard, from the settings view of that dashboard. Once you select the new theme from the dropdown list, click save button to save the changes, Once you select or change the theme of a dashboard, you can use the dashboard view to see a preview of the final dashboard


Saturday, February 11, 2017

WSO2 API Manager : Configure timeouts

A server connection timeout error does little to tell you what went wrong or why the error happened: it just identifies that the error occurred. Since Endpoints send the message out, they can encounter various transport errors. For example connection may time out, or connection may be closed by the actual service and even an Internet connection can be at fault.

Today we are talking how we can deal with Connection timed out errors in APIM.

Use-Case


Suppose a user is having a backend which is taking more than 5 -6 minutes to give a response back, The API that is waiting for backend response and will make timeout error after waiting 30000ms since exceeding of default value of the endpoint timeout by thinking connection may be closed by the actual service. 

We can get over with this kind of situations by doing manual configurations inside the apim configurations.        


There are 3 types of timeouts in API Manager

  • Endpoint timeout/connection timeout in per API level
  • Socket timeout
  • Global timeout


  1. When it’s needed to Set timeout in API level per each API you can go for following method. You can set the timeout value through management console for the API you want to increase the time out for 6 min.(60000miliseconds * 6 = 360000 ms)Please note that this configuration will override the "synapse.global_timeout_interval" value for that API

  2. <api name="admin--Emailverification" context="/phoneverify" version="1.0.0" version-type="url">
     <send>
       <endpoint name="admin--Emailverification_APIproductionEndpoint_0">
          <http uri-template="  http://ws.cdyne.com/emailverify/emailverify.asmx" />
          <timeout>
             <duration> 360000 </duration>
             <responseAction>fault</responseAction>
          </timeout>
       </endpoint>
    </send>
    </api>


  3. Socket timeout defined in the passthru-http.properties (APIMHOME\repository\conf\passthru-http.properties)

  4. http.socket.timeout=60000000
  • But According to the scenario we are talking here you can see endpoint timeout > http.socket.timeout since our default socket.timeout is 60000ms ..


  •  It's important If the endpoint timeout > http.socket.timeout, whatever value we set in endpoint timeout is not getting applied, but the value of http.socket.timeout will be used in request timeouts. Basically, when endpoint timeout > http.socket.timeout, the engine will timeout the endpoint after http.socket.timeout, irrespective of the timeout action or timeout value we configured in endpoint level.

  • So it is a must to configure http.socket timeout to higher value than the synapse global timeout or endpoint timeout values.

So I am increasing the socket timeout value here, adhering to the above condition ("http.socket.timeout=60000000" )

3. Global timeout defined in synapse.properties (\repository\conf\synapse.properties)This can’t be set per API level but when it’s applied it will affect globally for all API’s 

    synapse.global_timeout_interval=60000000


Note:

If you need any further assistancor have queries regarding the "WSO2 API Manager  : Configure timeouts Do not hesitate to comment below ....